Energy data for the University of Reading is now available online
2nd May 2018
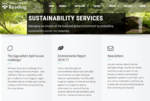
The University of Reading has launched a new website which makes half hourly energy data available to the public.
From
https://reading.ac.uk/sustainability/ users can access maps of the University’s three main campuses and click on key buildings to view their energy consumption.
Each building has an interactive dashboard showing daily electricity consumption, half hourly profiles for each day, and comparative measures illustrating the building’s energy performance. Users can zoom in on different time periods and select different days to investigate the consumption patterns in their buildings. Where possible energy used for heating, electrical submeters and generation from solar arrays are also available.
A separate dashboard compares the energy intensity of buildings per m2 floor area, grouping different building types to enhance comparisons.
Engaging staff and students
The new website has been well received, seeing an average of nearly 200 visitors to the energy data pages per month.
The University’s School of the Built Environment regularly uses the website in teaching and raw data is frequently requested by students using University buildings as case studies in their research. The site has opened up a dialogue with both students and staff, with a good response rate to questions posed on the site.
The wider scope of the website covers all aspects of sustainability including waste and recycling, sustainable travel information, policies and reports, regular blog articles and the Sustainability Matters newsletter.
Overall the website receives nearly 4,000 views per month and is the biggest form of communication about sustainability topics.
Making data available
The original concept for the new website was designed by two student summer interns. The logistics of how to present automatically updating data on the web were difficult, and the team went through several iterations of the website before landing on the current solution.
All of the University’s energy data is managed using Systemslink EMPlus, which collects data from a number of providers and stores them in a central database. PowerBI, a rapidly emerging software from the Microsoft suite, is used to query the database and present the data in interactive dashboards. These are then embedded in the website itself which is hosted on Wordpress.
As well as allowing embedded interactive reports, Wordpress is easy to customise and edit and provides detailed analytics about how the website is being used, essential feedback for the team.
What next
Now that the website is established, the team have plans to use it for further engagement with staff and students in the coming year. They are developing a mechanism for rewarding energy savings, particularly overnight and at weekends, and promoting competition amongst different buildings. New meters will be added and information and comparisons displayed will be evolved to keep the site fresh and engaging.


 Except where otherwise stated, content on this site is
licensed under a Creative Commons Attribution 3.0 License.
